Boosting Farm Performance: How IoT and AI Are Transforming Agriculture
Tue 19/08/2025 15m read 3398 views
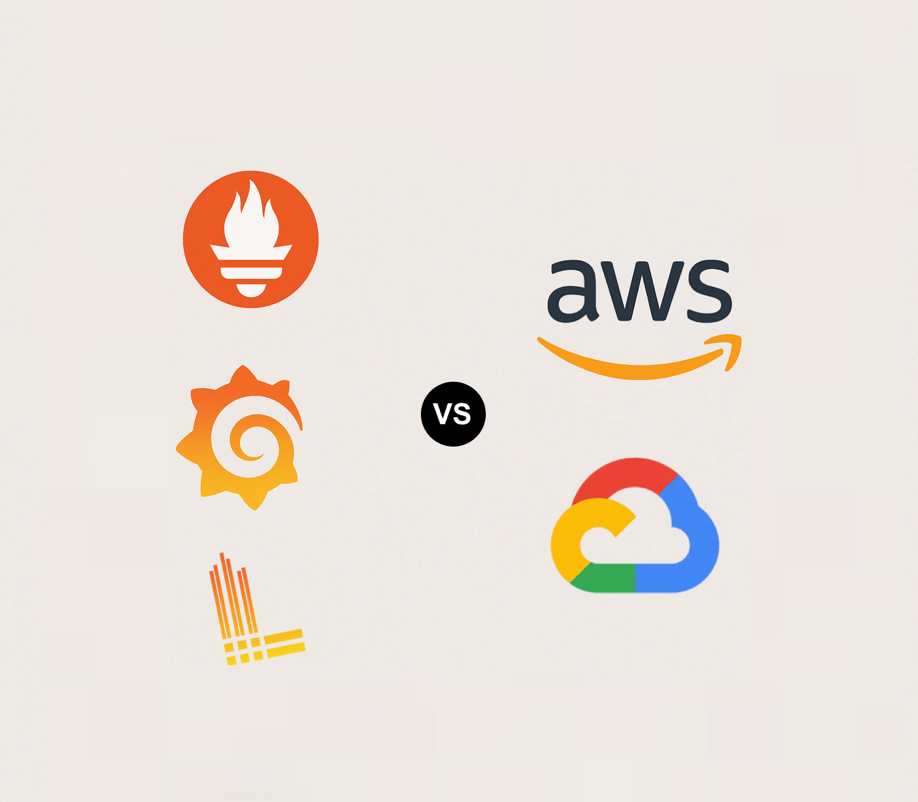
Prometheus & Grafana & Loki: Building a Unified Monitoring Stack
In today’s distributed and cloud-native world, software systems often span multiple clouds, on-premise servers, containerized environments, and third-party APIs. Monitoring such fragmented systems requires a powerful, flexible, and unified observability solution.
Three of the most popular open-source tools leading this movement are Prometheus, Grafana, and Loki. Individually, they are powerful. Combined, they form a consolidated monitoring powerhouse.
In this blog post, we’ll compare these tools, highlight how they complement each other, and explore how you can integrate them (along with other tools) to build cross-environment monitoring for modern software systems.
-
Overview of Each Tool
Prometheus: Metrics and Alerting
- Primary Function: Time-series database and monitoring system.
- Strength: Collects numerical metrics from targets via pull-based scraping.
- Key Features:
- PromQL (powerful query language)
- Alerting via Alertmanager
- Fast data retrieval and efficient storage
Grafana: Visualization and Dashboarding
- Primary Function:Visualizing data from multiple sources.
- Strength:Multi-data-source dashboards.
- Key Features:
- Supports Prometheus, Loki, Elasticsearch, InfluxDB, and more.
- Rich alerting and visualization tools.
- Can serve as a central control plane for observability.
Loki: Log Aggregation
- Primary Function: Log collection and querying.
- Strength: Lightweight, index-free architecture, tightly integrated with Grafana.
- Key Features:
- LogQL query language (PromQL-inspired)
- Cost-efficient log storage
- Seamless correlation with Prometheus metrics
-
How They Work Together
Feature Prometheus Grafana Loki Data Type Metrics (time-series) Multi-source visualization Logs Data Source Direct scrape / exporters Prometheus, Loki, 3rd party Promtail, Fluentd, syslog Query Language PromQL Integrated with PromQL, LogQL LogQL Visualization Basic (built-in UI) Advanced dashboards Full log viewing Alerting Alertmanager Dashboard-based alerts Basic log alerts via Grafana Combined Power:
- Prometheus: Scrapes system and app metrics.
- Loki: Collects structured and unstructured logs.
- Grafana: Visualizes both in unified dashboards and sets cross-source alerts.
-
Multi-Cloud & Hybrid Compatibility
Prometheus:
- Works well across Kubernetes, VMs, bare-metal, and cloud instances.
- Can be federated for multi-cloud setups.
- Requires some architecture planning to scale in multi-region environments.
Grafana:
- Easily connects to multiple Prometheus instances across clouds.
- Can pull in data from third-party monitoring systems like New Relic, Datadog, AWS CloudWatch, GCP Monitoring.
Loki:
- Can collect logs from multiple environments using agents like Promtail and Fluent Bit.
- Centralized querying across log streams from different infrastructures.
-
Integration with Other Monitoring Tools
Tool Integration Capability Prometheus Supports exporters for MySQL, Redis, NGINX, AWS, GCP, Azure, and more. Can federate with external Prometheus servers. Grafana Can integrate with New Relic, Elastic Stack, Jaeger (tracing), Datadog, AWS CloudWatch, and even custom APIs. Loki Compatible with Promtail, Fluentd, syslog, and integrates directly into Grafana. Can be connected with Elastic agents if needed. -
Building a Consolidated Monitoring Platform
Architecture Blueprint:
- Prometheus Layer:
- Federated across regions/clouds.
- Scrapes metrics from Kubernetes clusters, VMs, serverless functions.
- Loki Layer:
- Aggregates logs from all sources.
- Promtail agents deployed per environment.
- Grafana Layer:
- Single pane of glass for:
- Metrics (Prometheus)
- Logs (Loki)
- External sources (CloudWatch, New Relic, Datadog)
- Supports predictive alerts, anomaly detection, and cross-cloud dashboards.
- Single pane of glass for:
- Alertmanager:
- Centralized alert routing to email, Slack, PagerDuty, OpsGenie.
- Prometheus Layer:
-
Pros and Cons of This Stack
Pros Cons Open-source and cost-effective Requires setup and tuning Highly scalable and modular Multi-cloud Prometheus federation can be complex Deep ecosystem integration Limited native tracing (Jaeger or Tempo needed) Unified visualization across clouds Loki is newer, with growing but still maturing feature set -
Final Thoughts: The Power of Consolidation
Prometheus, Grafana, and Loki, when used together, offer a powerful, vendor-agnostic, and scalable solution for monitoring complex software systems across various environments.
They provide:
- Unified Observability: Metrics, logs, and alerts in one place.
- Cross-Cloud Flexibility: Monitor on-prem, cloud, and hybrid systems seamlessly.
- Open Ecosystem: Easy to integrate with other monitoring tools and third-party services.
If you want to future-proof your monitoring stack while maintaining control and flexibility, this trio is one of the best open-source options available today.
Related articles
