Enhancing Server and Host Monitoring with Prometheus, Grafana, and Alertmanager
In today’s fast-paced digital landscape, maintaining the health and performance of servers and hosts is critical. Whether you’re managing a handful of machines or an extensive infrastructure, effective monitoring ensures uptime, optimizes performance, and helps prevent costly outages. Three powerful open-source tools — Prometheus, Grafana, and Alertmanager — have become industry standards for achieving superior monitoring capabilities. In this post, we’ll introduce these tools and show how they can significantly enhance your server and host monitoring strategy.
Why Monitoring Matters
Modern applications and services rely heavily on a stable and responsive backend. Without proper monitoring:
- Small issues can escalate into major incidents.
- Performance bottlenecks remain invisible until they impact users.
- Troubleshooting becomes reactive rather than proactive.
By implementing robust monitoring with real-time metrics, visualizations, and alerting, you can detect anomalies early, optimize resources, and improve reliability.
Introducing Prometheus
Prometheus is an open-source monitoring and alerting toolkit originally developed by SoundCloud. It is designed for reliability and scalability, making it a favorite among DevOps teams worldwide.
Key Features of Prometheus:
- Time-Series Data Collection: Prometheus stores all metrics as time series data, allowing you to track changes over time.
- Flexible Query Language (PromQL): PromQL enables you to slice, dice, and transform collected data easily.
- Multi-dimensional Data Model: Metrics are stored with labels, making it easy to segment and filter based on various attributes.
- Self-contained Server: It doesn’t rely on distributed storage and can operate independently.
- Pull-based Metrics Collection: Prometheus actively scrapes targets for metrics at specified intervals, rather than relying on passive push mechanisms.
Prometheus is particularly adept at monitoring server metrics such as CPU usage, memory consumption, disk I/O, and network throughput. It supports exporters like node_exporter to expose system metrics that Prometheus can scrape.
Introducing Grafana
Grafana is a powerful open-source platform for visualization and analytics. While Prometheus focuses on gathering and storing data, Grafana excels at making that data understandable through rich, dynamic dashboards.
Key Features of Grafana:
- Flexible Data Source Integration: Grafana can pull data from Prometheus and many other sources (e.g., MySQL, Elasticsearch).
- Customizable Dashboards: Users can create detailed visualizations — from simple graphs to complex heatmaps and histograms.
- Alerting: Built-in alerting allows you to trigger notifications based on data thresholds.
- User Management and Sharing: Dashboards can be shared easily with teams, and user permissions can be finely controlled.
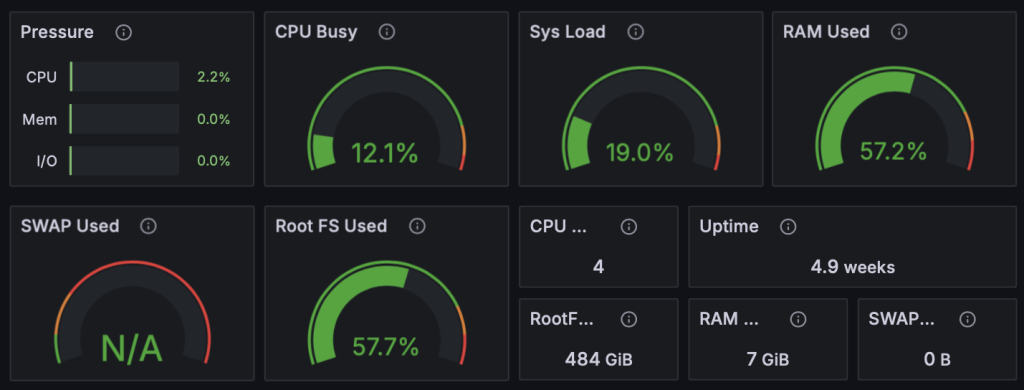
With Grafana, you can turn Prometheus’s raw metrics into intuitive, real-time visualizations, making it easier for teams to understand the health of servers and hosts at a glance.
Introducing Alertmanager
While Prometheus can detect anomalies and trigger alerts, Alertmanager is the tool responsible for managing those alerts — ensuring that they are delivered properly and efficiently to the right people.
Key Features of Alertmanager:
- Grouping Alerts: Similar alerts can be grouped into a single notification to avoid overwhelming users.
- Silencing Alerts: Temporary muting of alerts during known downtimes (such as maintenance windows) is easy to configure.
- Routing Alerts: Alerts can be routed based on their labels to different receivers (like email, Slack, PagerDuty, etc.).
- Deduplication: Alertmanager avoids sending multiple notifications for the same issue.
- Inhibition Rules: Automatically suppress alerts based on the presence of other active alerts (e.g., suppressing CPU usage alerts if the host is already down).
- Multiple Notification Channels: Supports sending notifications to various communication platforms including email, Slack, Opsgenie, and custom webhooks.
Why Use Alertmanager?
In a large infrastructure, hundreds of alerts can trigger during an outage. Without a system like Alertmanager, this can quickly lead to alert fatigue, where critical notifications are lost in a flood of noise. Alertmanager helps to prioritize, group, route, and control the flow of alerts, allowing teams to focus on what truly matters.
How Prometheus, Grafana, and Alertmanager Work Together
The integration among the three tools looks like this:
- Prometheus scrapes metrics from servers and hosts.
- When certain conditions are met, Prometheus generates alerts based on its configured alerting rules.
- Alertmanager receives these alerts, processes them according to routing and grouping rules, and sends notifications to the appropriate channels.
- Grafana queries Prometheus to visualize real-time and historical metrics, offering context and visual aid for ongoing alerts.
Together, they form a complete monitoring, visualization, and alerting ecosystem.
Conclusion
Building a reliable monitoring system with Prometheus, Grafana, and Alertmanager can greatly improve your infrastructure’s resilience and performance. These tools offer flexibility, scalability, and strong community support, making them ideal for teams of all sizes.
By proactively monitoring your servers and hosts, and by intelligently managing alerts, you’re not just preventing downtime — you’re empowering your organization to be more responsive, efficient, and proactive.