Comparing Prometheus + Grafana + Loki with AWS CloudWatch and Google Cloud Monitoring: Which Stack Fits Your Monitoring Needs?
As modern software systems become increasingly distributed across multiple clouds and environments, the need for a unified, flexible, and cost-effective monitoring solution is more critical than ever.
Two primary approaches dominate this space:
- Open-source monitoring stacks like Prometheus, Grafana, and Loki.
- Cloud-native monitoring services like AWS CloudWatch and Google Cloud Monitoring (formerly Stackdriver).
In this blog post, we’ll compare these two approaches head-to-head to help you decide which monitoring strategy best fits your software systems, especially when operating across different clouds, on-premises, and containerized setups.
Quick Summary Table
| Feature |
Prometheus + Grafana + Loki |
AWS CloudWatch |
Google Cloud Monitoring |
| Architecture |
Open-source, self-hosted |
Fully managed |
Fully managed |
| Multi-Cloud Support |
Vendor-agnostic, excellent for hybrid and multi-cloud |
AWS-centric |
GCP-centric (Google Cloud Platform) |
| Data Types |
Metrics (Prometheus), Logs (Loki), Visualization (Grafana) |
Metrics, Logs, Traces, Events |
Metrics, Logs, Traces, Events |
| Customization |
Highly customizable with PromQL and LogQL |
Moderate |
Moderate |
| Ease of Setup |
Requires infrastructure management |
Simple in AWS |
Simple in GCP |
| Cost |
Mostly infrastructure and storage costs |
Pay-per-use, can become expensive at scale |
Pay-per-use, can become expensive at scale |
| Integration with Other Tools |
Broad (multi-vendor) |
Strong for AWS services |
Strong for AWS services |
| Vendor Lock-in Risk |
Low |
High |
High |
Detailed Comparison
-
-
Architecture & Deployment
- Prometheus + Grafana + Loki:
- You control deployment: on-premises, Kubernetes, VMs, or any cloud.
- Scalable through federation and clustering.
- Requires managing storage, backups, and availability.
- AWS CloudWatch/Google Monitoring:
- Fully managed services.
- Simple setup within their respective ecosystems.
- No infrastructure overhead, but limited customization outside their clouds.
-
Multi-Cloud & Hybrid Monitoring
- Prometheus Stack:
- Native support for multi-cloud and hybrid setups.
- Can scrape metrics from AWS, GCP, Azure, Kubernetes, on-prem, and edge devices.
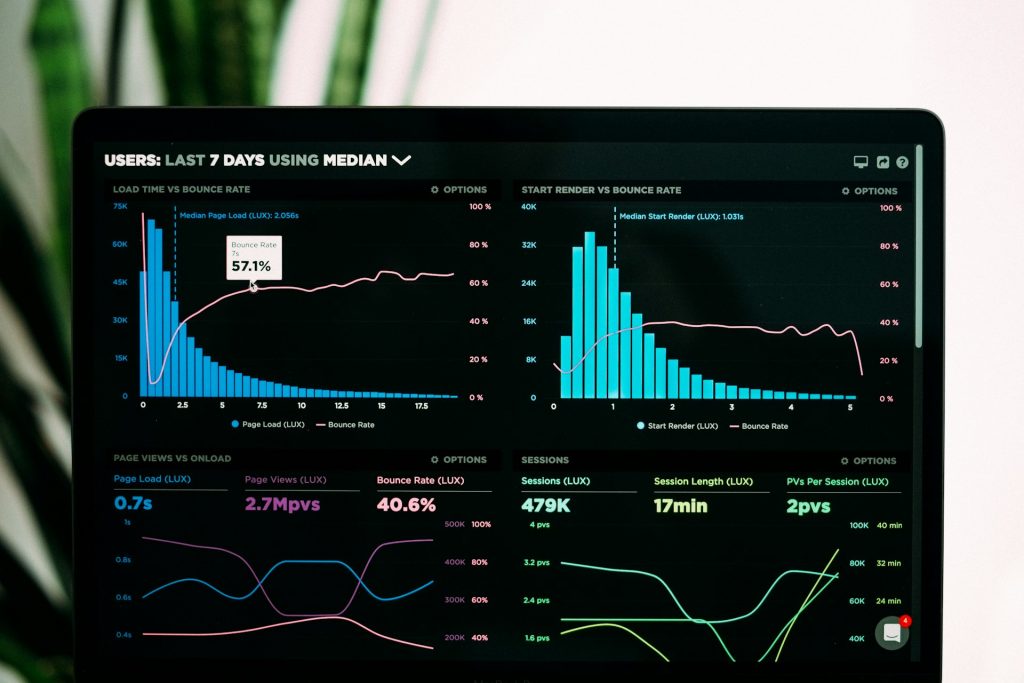
- Grafana can consolidate multiple Prometheus instances, CloudWatch, GCP, and even third-party SaaS tools into a single dashboard.
- CloudWatch:
- Deep integration with AWS resources but limited visibility into non-AWS environments.
- External integration is possible but clunky and often incurs extra cost.
- Google Cloud Monitoring:
- Seamlessly tracks GCP resources.
- Cross-cloud support requires additional setup and often depends on using Google’s agents.
-
Data Collection and Querying Power
- Prometheus + Loki:
- PromQL and LogQL offer powerful, customizable queries.
- Seamless correlation between logs and metrics via Grafana.
- Can integrate tracing tools like Jaeger or Tempo.
- CloudWatch:
- Uses CloudWatch Logs Insights for log queries (limited flexibility compared to LogQL).
- CloudWatch Metrics support basic and custom queries, but less powerful than PromQL.
- Tracing is possible with AWS X-Ray.
- Google Monitoring:
- Native integration with Google’s Operations Suite.
- Querying via MQL (Monitoring Query Language), which is good but less widely adopted than PromQL.
- Integrated with Google Cloud Trace and Google Cloud Logging.
-
Alerting and Automation
- Prometheus + Grafana:
- Prometheus Alertmanager for metric-based alerts.
- Grafana can send alerts across multiple sources (email, Slack, PagerDuty, etc.).
- Supports predictive and anomaly-based alerts with Grafana’s ML plugins.
- CloudWatch:
- Cloud-native alerting via CloudWatch Alarms.
- Supports simple thresholds and composite alarms but limited predictive capabilities.
- Integrated with AWS SNS for notifications.
- Google Monitoring:
- Supports condition-based and time-based alerting.
- Integrated notification via Google Cloud’s Pub/Sub, email, SMS.
- Offers some basic anomaly detection.
-
Cost Considerations
- Prometheus Stack:
- Primarily pays for storage and compute (especially if self-hosted on your own cloud infrastructure).
- Cost-effective for large-scale, multi-cloud setups when tuned correctly.
- CloudWatch:
- Charges for metrics ingested, dashboards, custom metrics, API calls, and log storage.
- Costs can escalate rapidly with high-volume applications.
- Google Monitoring:
- Similar pricing model to CloudWatch (pay-per-use).
- Cost can be significant for high-cardinality metrics or verbose logs.
-
Ecosystem Integration
- Prometheus + Grafana:
- Compatible with AWS CloudWatch, Google Monitoring, Azure Monitor, Elasticsearch, New Relic, Datadog, and many more.
- Excellent for consolidating multi-source observability in a single pane of glass.
- CloudWatch:
- Deeply integrated with AWS Lambda, EC2, ECS, RDS, S3, API Gateway, and more.
- Limited third-party integration without extra configuration.
- Google Monitoring:
- Fully integrated with GCP Compute Engine, Cloud Run, Kubernetes Engine, BigQuery, Cloud Functions.
- Non-GCP integrations require connectors or agents.
Which Should You Choose?
| Scenario |
Best Fit |
| Multi-cloud or hybrid environment |
Prometheus + Grafana + Loki |
| Primarily AWS workloads |
AWS CloudWatch |
| Primarily GCP workloads |
Google Cloud Monitoring |
| Cost-sensitive large-scale systems |
Prometheus + Grafana + Loki |
| Quick, out-of-the-box cloud monitoring |
AWS CloudWatch / Google Monitoring |
| High customization & vendor-agnostic dashboards |
Prometheus + Grafana |
Final Thoughts
If your systems are spread across multiple clouds, Kubernetes clusters, and on-premise data centers, Prometheus, Grafana, and Loki provide the most flexible and unified monitoring solution.
On the other hand, AWS CloudWatch and Google Cloud Monitoring are fantastic if you are deeply committed to their ecosystems and want fully managed monitoring with minimal setup.
For most growing organizations, a hybrid approach is ideal:
-
- Use AWS CloudWatch/Google Monitoring for native cloud services.
- Use Prometheus + Grafana + Loki as the cross-cloud, vendor-neutral monitoring layer to unify all environments.